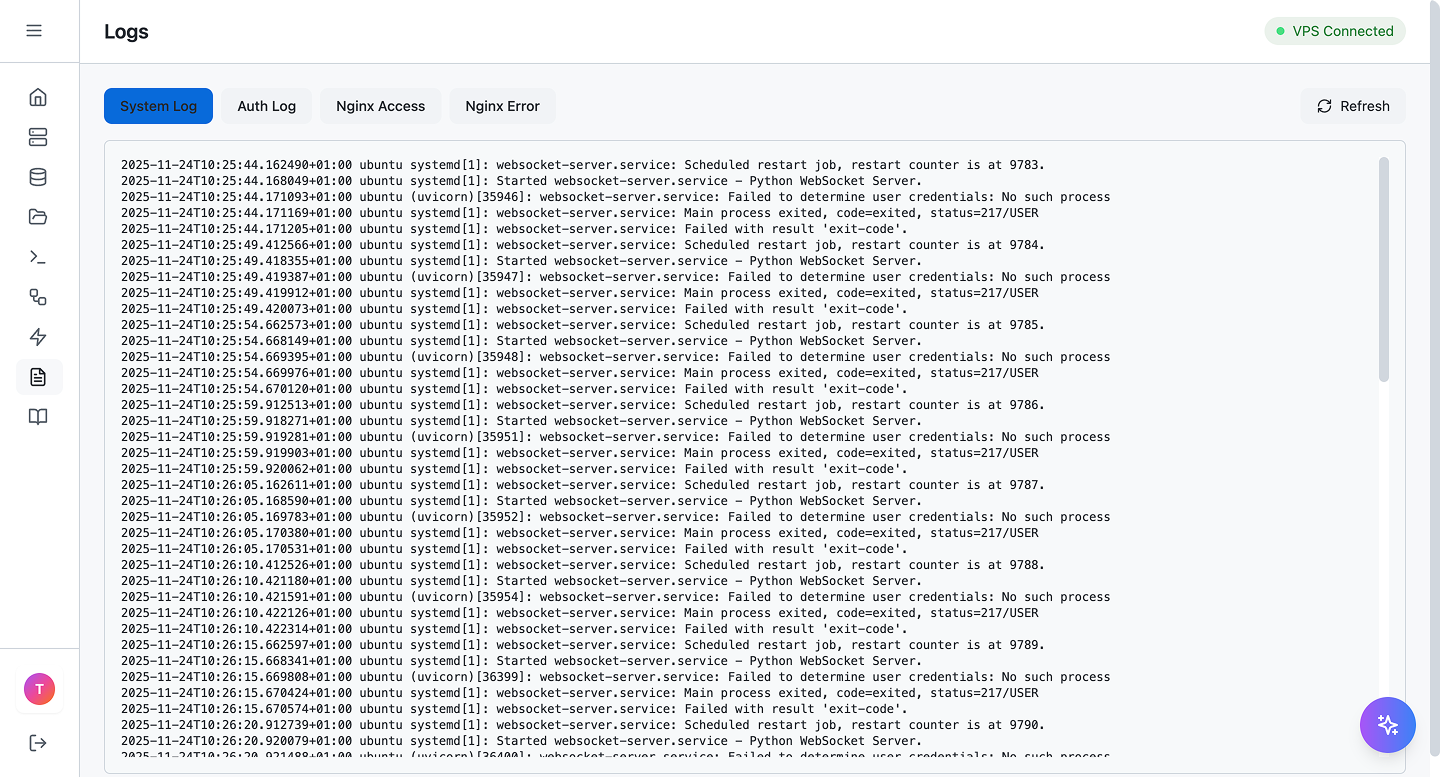
Monitor everything. In real-time.

Complete visibility into your server's health. Track CPU, memory, disk, network, and processes from a unified dashboard.

Complete server visibility at a glance

Stop SSHing in to check server stats. Monitor everything from a beautiful, real-time dashboard.
CPU Usage
45%
4 cores active
Memory
8.2 GB
of 16 GB used
Disk Space
62%
124 GB free
Network
2.4 MB/s
↓ 1.8 ↑ 0.6
Server monitoring dashboard
💾

Storage monitoring

Monitor disk usage across all mounted filesystems. Get alerts before you run out of space.

  • Disk space per partition
  • Inode usage monitoring
  • Disk I/O statistics
🔄

Process control

See which processes are consuming resources. Track network traffic and active connections in real-time.

  • Top processes by CPU/memory
  • Network traffic monitoring
  • Process management controls
Real-time monitoring interface

Real-time updates every second

Live data streaming without page refresh. See changes as they happen.

📊

Real-Time Updates

Live data streaming every second. See changes as they happen without refreshing.

🎯

Unified Dashboard

All metrics in one place. No more jumping between terminal windows and monitoring tools.

📈

Historical Data

View trends over time. Identify patterns and plan capacity upgrades proactively.

⚠️

Smart Alerts

Get notified when resources exceed thresholds. Prevent downtime before it happens.

🔍

Detailed Insights

Drill down into any metric. Understand exactly what's consuming your server resources.

🚀

Zero Configuration

No agents to install. Monitoring starts automatically when you connect your server.

Trusted by 1000+ developers worldwide

Start monitoring your servers

Get complete visibility into your infrastructure in under 60 seconds. No credit card required to start.

400+
Pre-built workflows
1000+
Active users
24/7
Server monitoring